The true cost of a replacement is scattered across different reports. Maintenance records labour hours against a job card. Procurement records the replacement part and, when it’s urgent, the freight. Production records the metres that weren’t drilled.
Each figure is accurate, but when those measures sit in different systems or functions, no report shows what a component actually cost the operation over its service life.
Component performance influences all of those figures. It has a direct influence on how often the operation has to commit people, parts and equipment access to that component, and what each of those commitments involves.
Unit price, operating conditions and asset-level factors all shape the final economics, and each operation will balance them differently. What the component contributes to the equation is recurring operational demand, and the cost of that demand can be far larger than what a price tag suggests.
The operational demand behind reliability
Every intervention creates a requirement. A replacement part has to be on the shelf, a crew has to be allocated, and the machine has to be taken out of service and made safe to work on. How often that cycle repeats matters, but frequency on its own understates what a component asks of the operation.
Ten planned change-outs completed during scheduled services are absorbed into a plan the operation has already built. Ten unplanned failures arrive on their own schedule, and each one can pull crews off planned work or call them out after hours, require parts to be expedited, and leave a production-critical rig standing idle while the site waits. Maintenance personnel may also end up working under time pressure on a job that wasn’t in the plan, which can increase safety exposure as well as cost.
The operational demand created by a component depends on how often it needs attention, what it demands, and whether the operation can see it coming.
Reading the pattern instead of a snapshot
The significance of that demand becomes clearer over time. A single maintenance event rarely shows the full picture of component performance. More can be learned from whether the event forms part of a recurring pattern and how that pattern changes over the operating life of the equipment.
A component may remain in service while requiring increasingly frequent attention. Looking across operating hours and maintenance history can reveal changes that are difficult to see from an individual intervention, such as shorter service intervals or recurring premature failures.
When a component repeatedly falls short of its expected service life, it is worth exploring solutions beyond replacement.
When engineering changes the demand
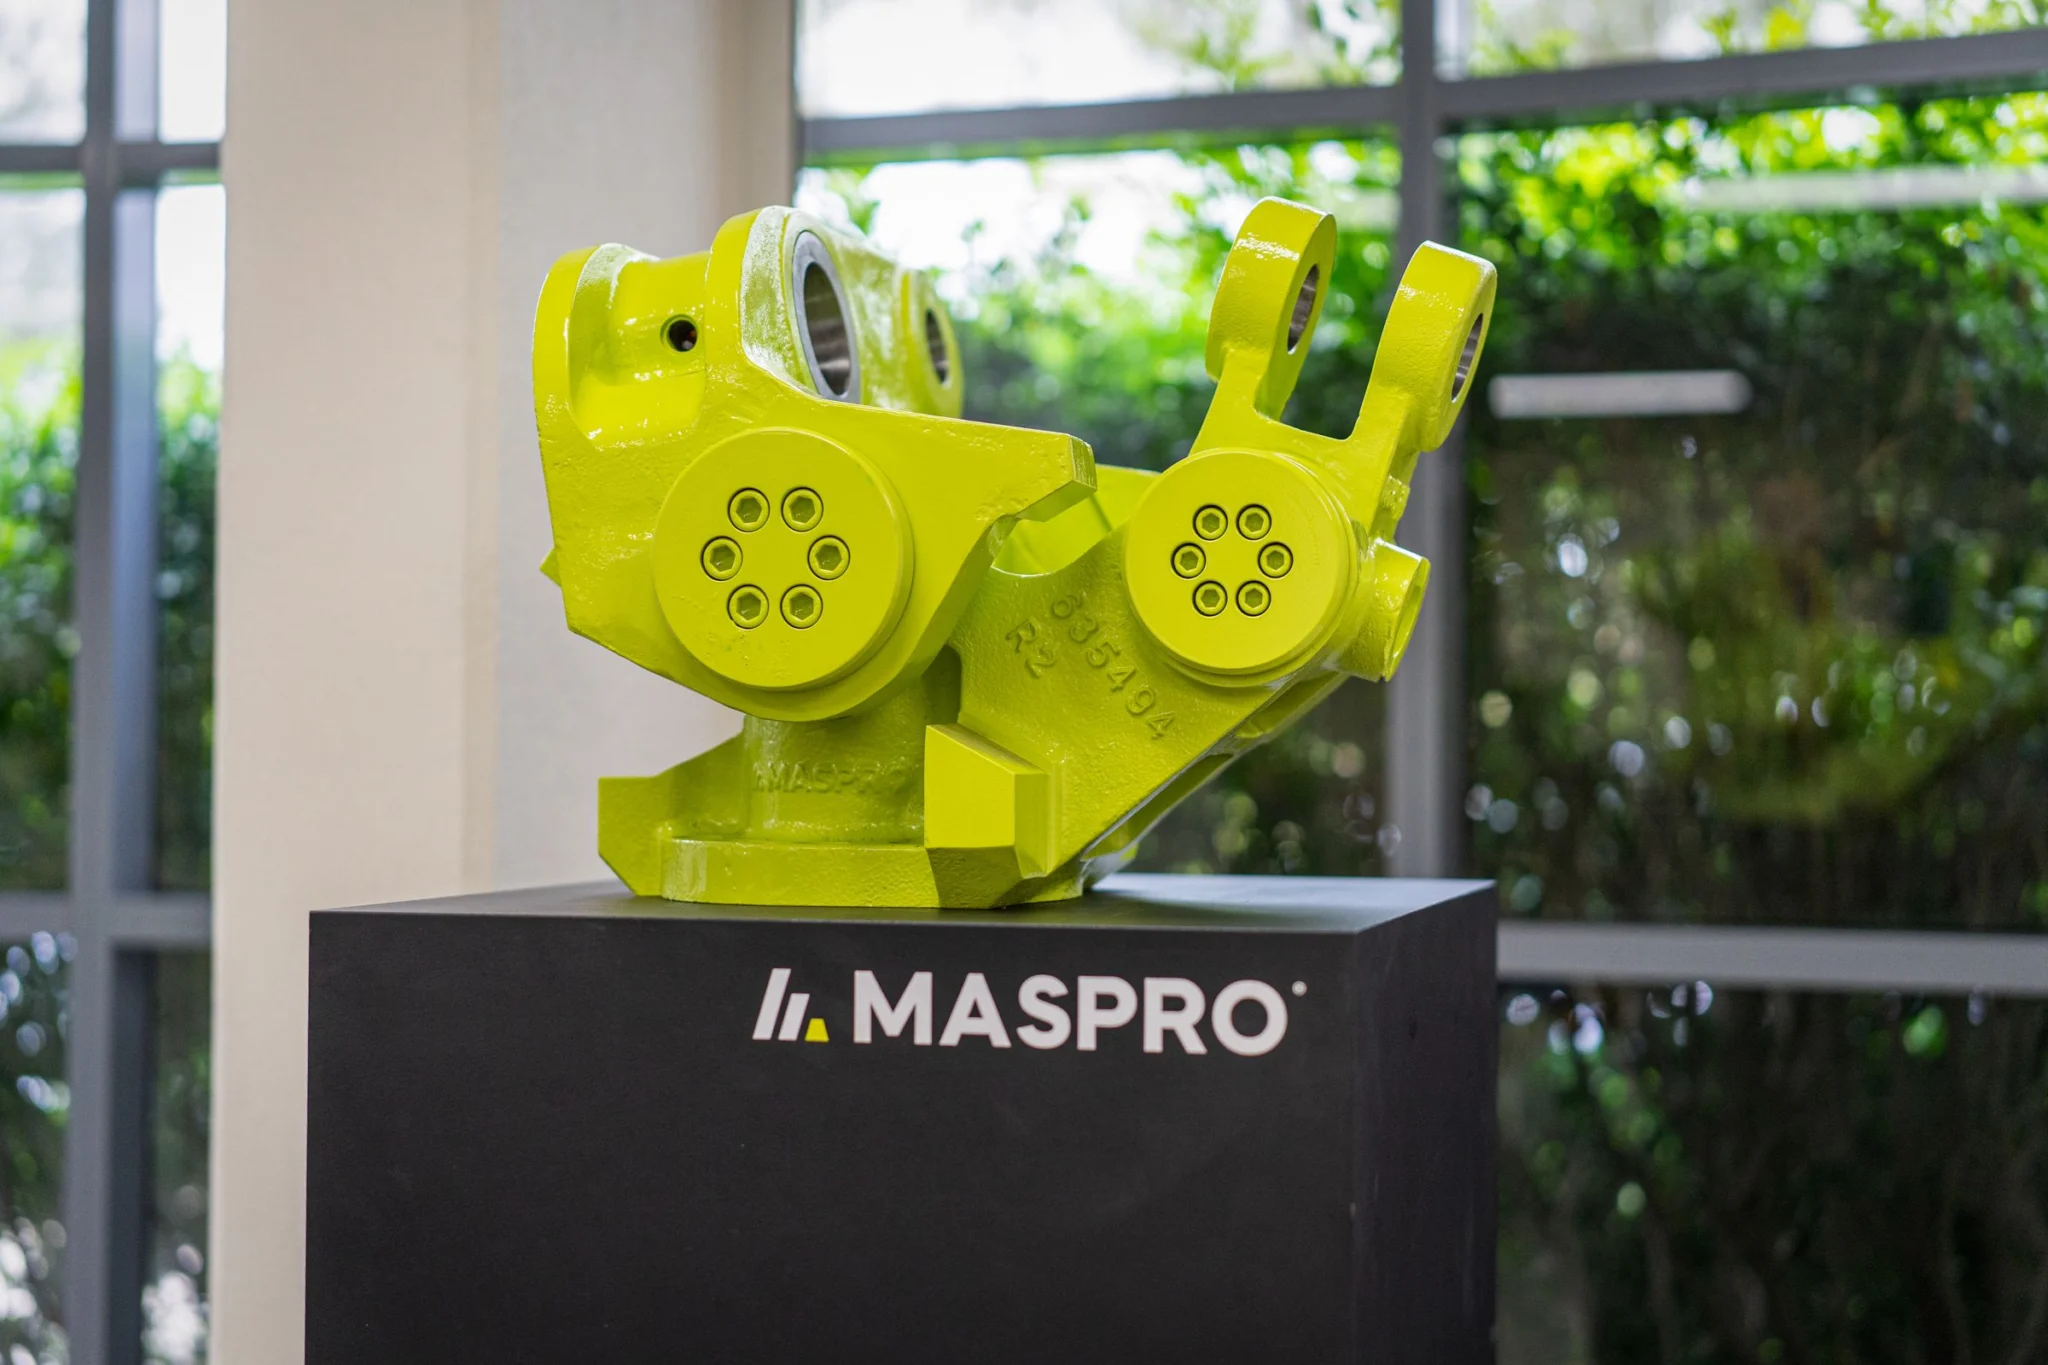
A rotation head operating on an Epiroc D65 surface drill fleet provides an example of how component performance can change the lifecycle equation. The existing rotation heads were experiencing recurring premature failures and were not consistently reaching the scheduled 6,000-hour service interval. This was reducing drill availability, creating unplanned maintenance interventions and increasing component replacement costs.
Working with the customer’s reliability engineers, MASPRO identified axial movement within the gear-to-spindle interface that was creating internal stress and premature fatigue. Rather than simply reinforcing the existing component, the engineering response addressed the way the gear was retained on the spindle to reduce gear movement and minimise damage to internal components. The redesigned rotation head could be mounted without modification to the drill.
The change increased rotation head service life by 154 per cent, with units achieving up to 11,000 operating hours. The improvement also reduced annual component expenditure by 89 per cent, while reducing maintenance interaction and improving scheduled availability.
The economic impact becomes clearer when those results are considered together. Component value can be assessed through the cost per operating hour achieved relative to the previous component performance. But when the labour expense associated with repeated replacements and the cost of avoided downtime were also considered, the estimated return from the engineering change for this client exceeded the A$1.2 million yearly.
Connecting reliability to lifecycle economics
Reliability’s contribution becomes clearer when reading together the figures that normally sit in separate reports: component expenditure, replacement frequency, maintenance hours, equipment access and unplanned events. Evaluated together over time, they provide a more transparent picture of how component behaviour contributes to the broader lifecycle economics of an asset.
Bringing that information into one view is often the first step towards understanding which components are placing the greatest demand on the operation.
This view is central to how MASPRO defines reliability: considering how predictably a component behaves in service and what it asks of the operation around it, as well as how long it lasts.
If you put the maintenance, procurement and production numbers for one component side by side, which one would surprise you?